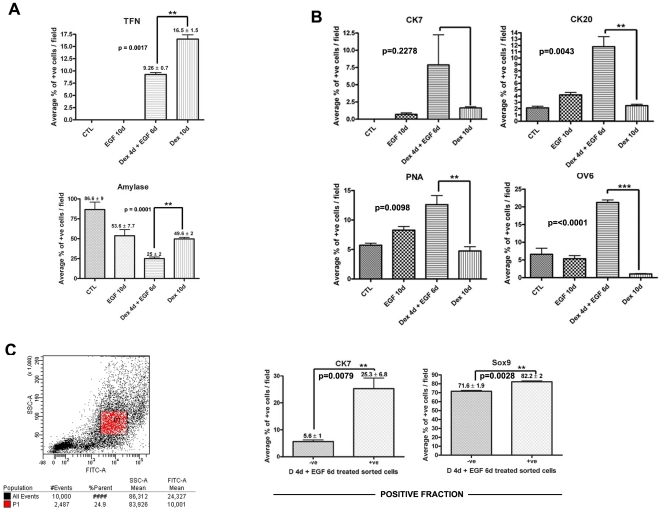
Figure 3. EGF enhances the ductal phenotype at the expense of the hepatic phenotype.
Bar charts showing the percentage of cells expressing (A) Amylase and Transferrin (B) CK7, CK20, PNA and OV-6 in control, EGF, Dex/EGF and Dex treated cells. (C) Scatter plot from the FACSCanto showing the intensity of PNA staining in Dex/EGF treated cells and bar charts showing percentage of cells positive for CK7 and Sox9 (positive fraction) following MACS isolation. Scale bars, top and middle row, 20 µm; lower row, 50 µm.

