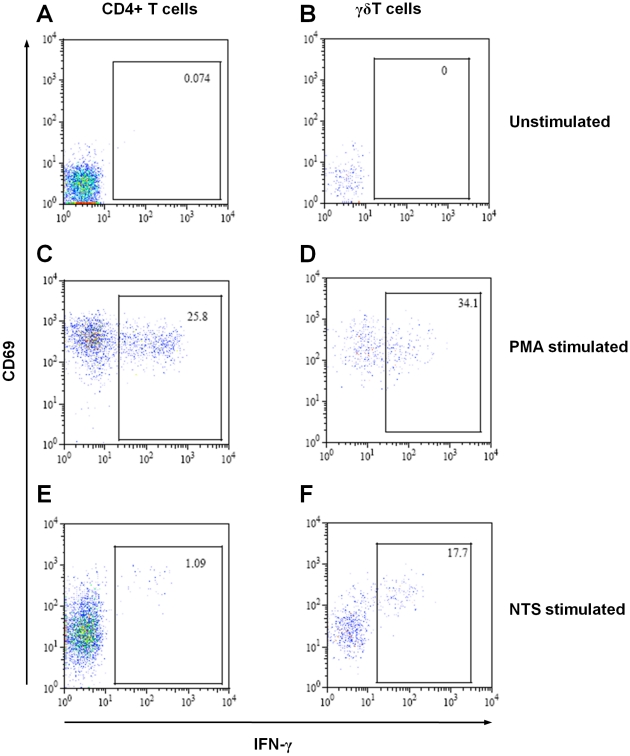
Figure 1. Detection of IFNγ-producing lymphocytes by flow cytometry following stimulation with Salmonella.
Dot plots of CD4+-T cells (A, C and E) and γδ-T cells (B, D and F) from human peripheral blood from one healthy adult, either unstimulated (A and B), or stimulated with PMA (C and D) or S. Typhimurium D23580 homogenate (E and F), showing intracellular production of IFNγ and expression of CD69. Numbers within gates indicate percentage of IFNγ-producing cells. Each dot represents one cell.

