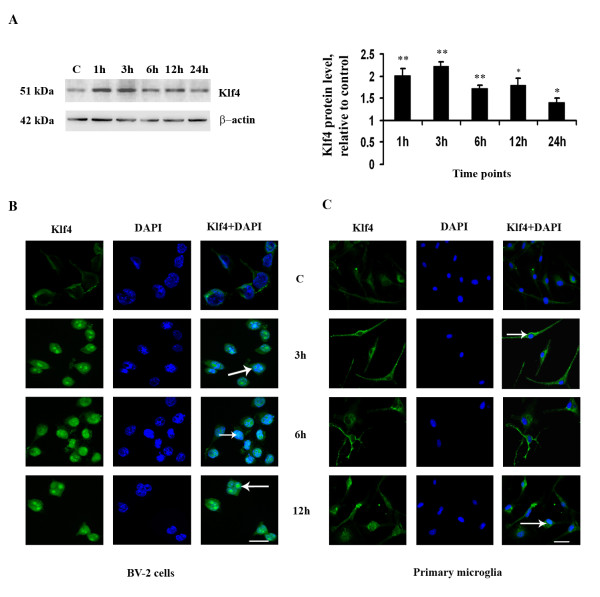
Figure 2.
Nuclear expression and translocation of Klf4 in response to LPS. Immunoblotting was carried out for nuclear extracts from LPS-treated BV-2 cells in a time-dependent manner. (A) A significant increase is observed in Klf4 levels in nuclear extracts at the 1 h and 3 h time points. The graph represents nuclear Klf4 protein levels relative to untreated controls. *, **, Statistical differences in comparison to control values (* p < 0.05; ** p < 0.01). For nuclear translocation studies, immunofluorescence for Klf4 was carried out in BV-2 cells and primary microglia. (B) Increased expression and nuclear translocation of Klf4 in BV-2 cells at 3 h, 6 h and 12 h time points, indicated by arrows. (C) Increased expression of Klf4 in mouse primary microglia cells and nuclear localization of Klf4 at the 12 h time point are indicated by arrows. Scale bar: 20 μm.

