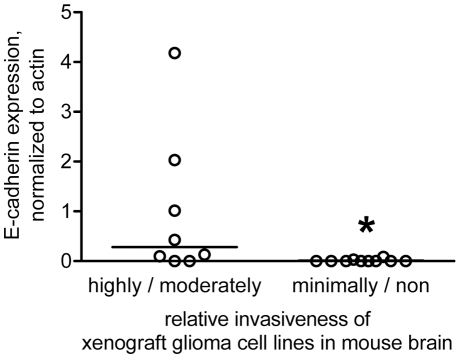
Figure 3. E-cadherin protein expression correlates with glioma cell invasiveness in an orthotopic xenograft mouse model.
Xenograft cell lines 5, 6, 8, 10, 12, 14, 15, 16, 22, 26, 28, 34, 36, 38, 43, 44, 46, and 59 were examined for relative invasiveness following orthotopic injection into mouse brain. Lines were categorized as highly, moderately, minimally, or non invasive. The level of E-cadherin expression (relative to actin expression) determined by Western blot for each cell line was then plotted vs. relative glioma invasiveness. The lines through the data indicate the median for each invasiveness category; *indicates a statistical difference (one-tailed, unpaired t test) between the two categories of invasiveness at p<0.05.

