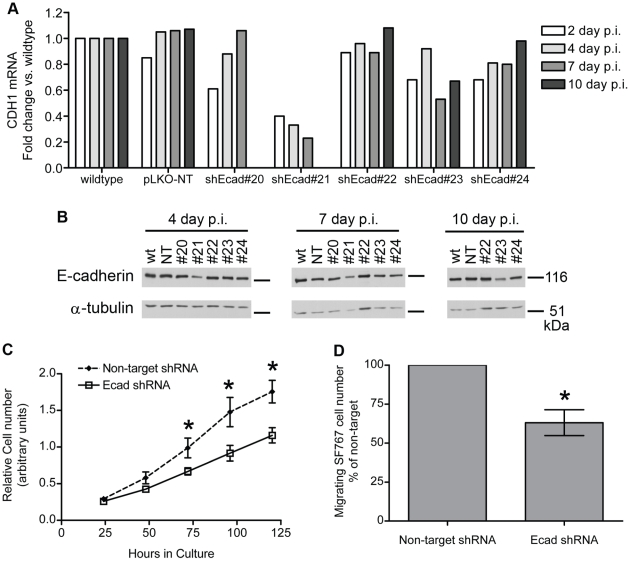
Figure 6. E-cadherin depletion inhibits SF767 growth and migration.
A. SF767 cells were infected with lentivirus expressing either non-target shRNA or E-cadherin shRNA on day zero, and then harvested on days 2, 4, 7, and 10 post-infection (p.i.). RNA from the cells was used for quantitative RT-PCR analysis of CDH1 mRNA, normalized to the expression of GAPDH mRNA; data is plotted as fold change vs. the normalized CDH1 levels in wild-type SF767 cells. The shEcad#20 cell line was discarded after 7 days p.i. due to lack of difference with the pLKO-NT cells in terms of growth rate, morphology, and CDH1 mRNA expression. The shEcad#21 cell line grew poorly and was completely harvested by 7 days p.i. B. Additional cells were harvested on days 4, 7, and 10 p.i. for protein analysis. Western blot was used to determine knockdown of E-cadherin; α-tubulin is a loading control. The generally poor condition of SF767-shEcad#21 cells by day 7 p.i. is reflected in the reduced levels of α-tubulin seen on the blot, despite loading equal µg of total protein from each sample. C. Growth rates of E-cadherin-depleted SF767-shEcad#23 vs. control SF767-non target cells were determined over 5 days using an MTT assay. E-cadherin-depleted SF767 cells grew more slowly than control SF767 cells. This difference is statistically significant at 72, 96, and 120 hours in culture (2-way ANOVA followed by Bonferroni post hoc tests; * indicates p<0.05). These two cell lines were generated independently of those displayed in parts A and B. D. Migration of E-cadherin-depleted SF767-shEcad#23 vs. control SF767-non target cells (the same cell lines used for the growth experiment in C) was determined using a Boyden chamber trans-well migration assay. Fewer E-cadherin-depleted SF767 cells than control SF767 cells migrated toward the chemoattractant. The difference is statistically significant (paired t-test; * indicates p<0.05).

