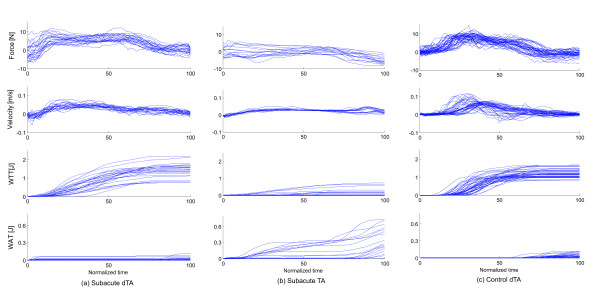
Figure 3.
Measured movement parameters. Comparison of measured parameters in a subacute dTA subject (a), a subacute TA subject (b) and a control subject (c). The end-effector force, the movement velocity, the work toward target (WTT) and the work away from target (WAT) are shown. The parameters are observed in the tangential direction on the central curve line. The lines represent different trials for the same subject.

