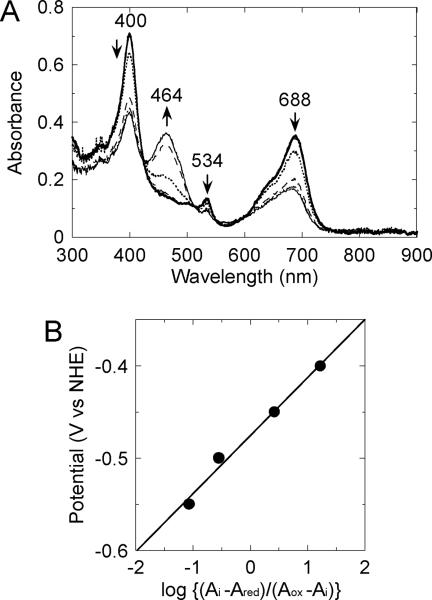
Fig. 4.
Electrochemical reduction of ferrous verdoheme-rHO-1 complex under anaerobic conditions. (A) Absorption spectra of the verdoheme-rHO-1 complex (0.1 mM) during the electrochemical-optical titration at 25 °C were recorded. The experimental conditions and procedures are described in the EXPERIMENTAL section. Applied potentials were: +0.22 (rest potential, ), −0.40 ( -.-.-.- ), −0.45 ( …….. ), −0.50 (- - - -), -0.55 ( -…-…- ), and -0.60 V (
 ) vs NHE. (B) The Nernst plot obtained from the absorbance change at 688 nm of the ferrous verdoheme-rHO-1 complex.

