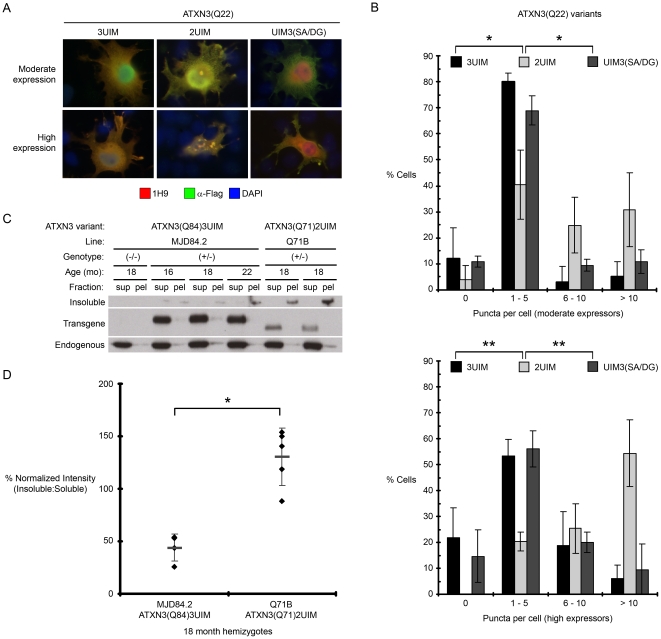
Figure 4. 2UIM ataxin-3 is more prone to aggregate than 3UIM ataxin-3.
(A) Representative immunofluorescence of Cos7 cells transiently expressing Flag-tagged ataxin-3(Q22) splice isoforms or the UIM3(SA/DG) mutant. Cells were gated by fluorescence intensity into populations of moderate and high expressors. (B) Quantification of puncta per cell in (A). Error bars represent the standard deviation within each bin. Frequency distributions differ significantly between ATXN3(Q22)2UIM and ATXN3(Q22)3UIM and between ATXN3(Q22)2UIM and ATXN3(Q22)UIM3(SA/DG) mutant ataxin-3 (*p<0.0001, ** p<1×10-11), but not between ATXN3(Q22)3UIM and ATXN3(Q22)UIM3(SA/DG) mutant ataxin-3 by a χ2 test for independence, df = 3. (C) Supernatant (sup) and pellet (pel) fractions of non-denaturing RIPA brain lysates from aged MJD84.2 (ATXN3(Q84)3UIM) and Q71B (ATXN3(Q71)2UIM) hemizygous transgenic mice were analyzed by Western blot with 1H9 anti-ataxin-3 antibody. Insoluble microaggregates are detected at the base of lane wells, whereas soluble transprotein and endogenous ataxin-3 are visualized within the resolving gel. (D) Quantification of the ratio of insoluble to soluble ataxin-3 transprotein seen in (C). 3UIM-predominant MJD84.2 mice show a significantly lower ratio of insoluble:soluble transprotein than 2UIM-only Q71B mice (*p<0.0005 by a 1 tailed heteroscedastic Student's t-test).

