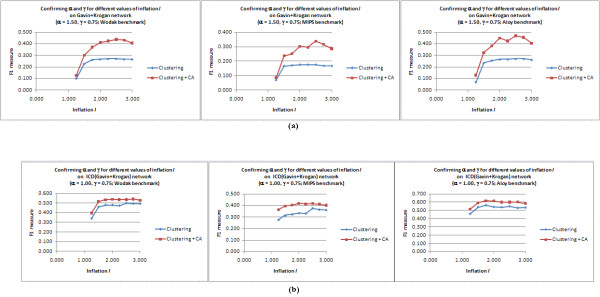
Figure 4.
Reconfirming inflation I for MCL-Caw. (a): Plot for the unscored Gavin+Krogan network with α = 1.50 and γ = 0.75. (b): Plot for the scored ICD(Gavin+Krogan) network α = 1.00 and γ = 0.75. I = 2.5 gave the best F1 for these chosen values of α and γ (except on the Aloy benchmark, the smallest benchmark among the three, on which I = 1.75 gave marginally better F1).

