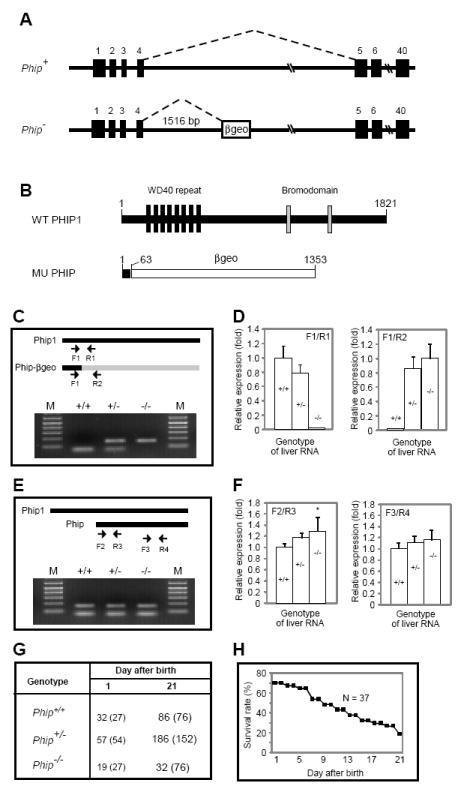
Figure 1. Generation and characterization of Phip gene-trap mice.

(A) Schematic representation of wild-type (Phip+) and mutant (Phip-) Phip alleles. Filled boxes represent exons; the open box in Phip- denotes the gene trap cassette. Dashed lines indicate RNA splicing events. (B) Schematic representation of wild-type and mutant PHIP peptides generated from Phip+ and Phip-, respectively. The number of amino acids for each peptide is indicated. The mutant peptide is a fusion protein containing the N-terminal 63 amino acids of PHIP1 and full-length βgeo. (C and E) RT-PCR analysis of liver RNAs from Phip+/+, Phip+/- and Phip-/- mice. PCR primers (arrows) and their locations in corresponding cDNAs are indicated on the top. For each genotype, PCR products from the indicated two primer pairs were pooled and resolved using a 2% agarose gel. In C, upper and lower bands represent products amplified by F1/R2 and F1/R1, respectively. In E, upper and lower bands represent products amplified by F2/R3 and F3/R4, respectively. (D and F) Quantification of transcripts in C and E by quantitative RT-PCR. Genotypes of the RNA are indicated as +/+, +/- and -/-, respectively. qPCR primers are shown on top of the bar graph. N = 3 mice per genotype, *, p < 0.05 Phip-/- versus Phip+/+ mice. (G) Distribution of Phip+/+, Phip+/- and Phip-/- mice. Numbers in parentheses indicate expected distribution. (H) Survival rate of Phip-/- mice during postnatal period. A total of 37 newborn Phip-/- pups were monitored in a 3-week window.
