
Figure 2. Inactivation of PHIP1 impairs postnatal whole body growth.
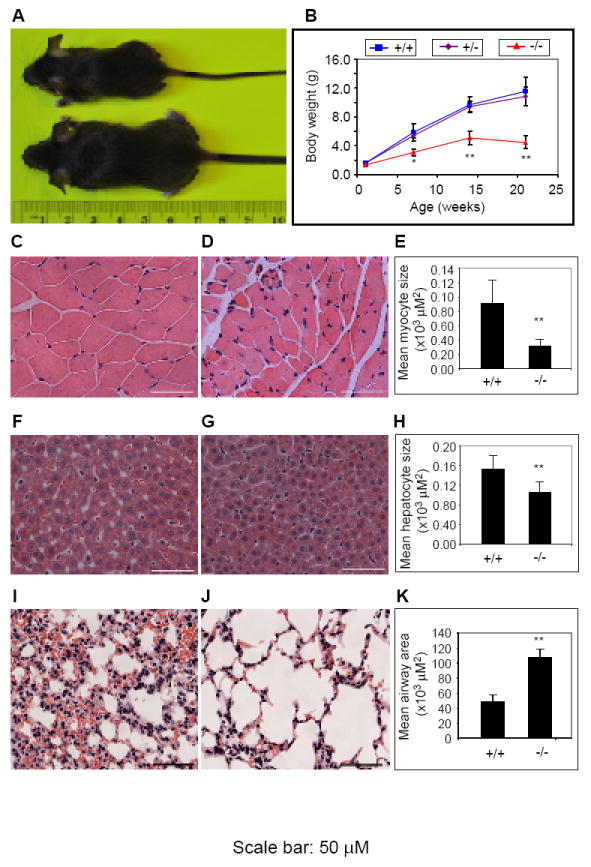
(A) Representative images of Phip+/+ (bottom) and Phip-/- (top) mice at 4 weeks of age. (B) Postnatal body weight gain profiles of Phip+/+, Phip+/- and Phip-/- mice. N = 10 per genotype, *, p < 0.05, **, p < 0.01 Phip-/- versus Phip+/+ mice. (C-D) H&E staining of hindlimb skeletal muscle cross sections from Phip+/+ (C) and Phip-/- (D) mice. (F-G) H&E staining of liver sections from Phip+/+ (F) and Phip-/- (G) mice. (I-J) H&E staining of lung sections from Phip+/+ (I) and Phip-/- (J) mice. (E, H and K) Quantification of sizes of myocytes (E), hepatocytes (H) and lung airways from Phip+/+ and Phip-/- mice. N = 3 per genotype, **, p < 0.01 Phip-/- versus Phip+/+ mice. All data are expressed as mean ± standard deviation. Scale bar: 50 μM.