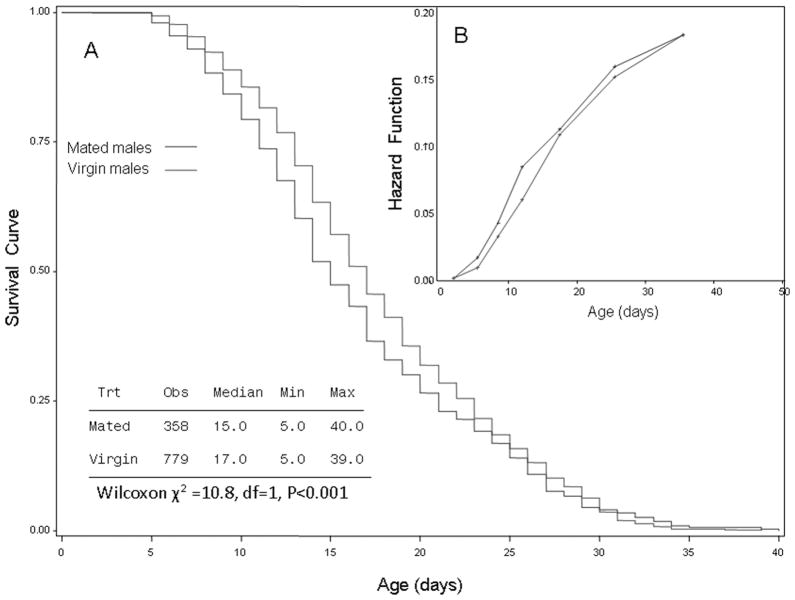
Fig. 2.
Plots of survival curves estimated (using the Kaplan-Meier method) of virgin and mated males (A). Summary statistics are shown in the table, and the statistical significance of the difference in survival between groups is shown based on the Wilcoxon test. Inset (B) shows the corresponding estimated hazard functions for the two groups (see Results for details).

