
Figure 2.
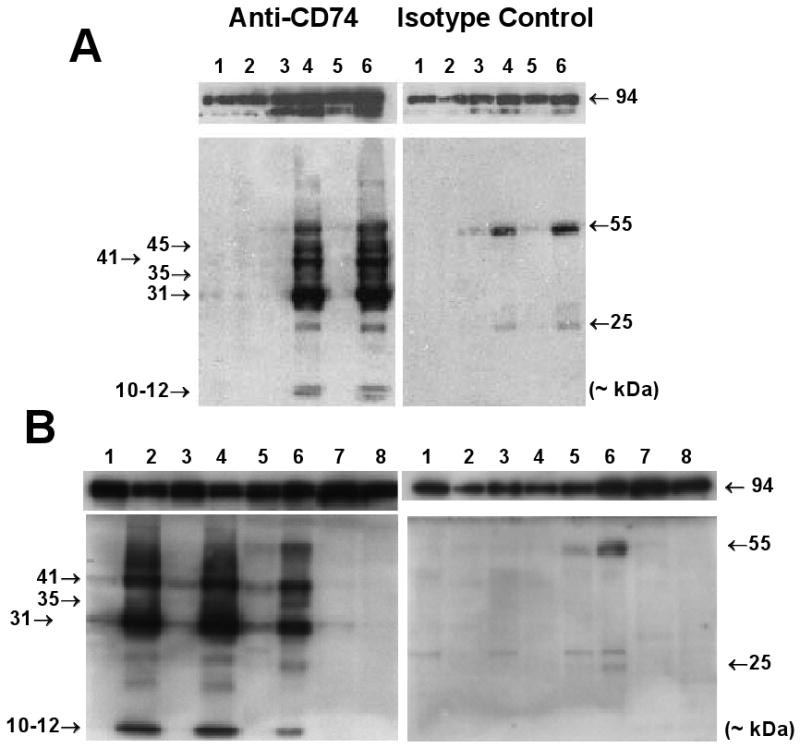
Detection of CD74 in cell extracts on Western Blots. (A) IkkβF/F and IkkβΔhep mouse livers, and cultured MEFs (each lane from a separate mouse). Lanes: 1 (wildtype MEFs), 2 (Ikkβ-/- MEFs), 3 (♂IkkβF/F liver), 4 (♂IkkβΔhep liver), 5 (♀IkkβF/F liver), 6 (♀IkkβΔhep liver). Non-specific ∼25 kDa and ∼55 kDa bands in isotype control panels (right upper and lower) likely reflect non-specific cross-reactions with serum or reagent light and heavy IgG chains. (B) Ikkβ+/+:Alb-Cre mouse livers and spleens, and cultured MEFs (each lane from a separate mouse). Lanes: 1 (♂ #1, Alb-Cre liver), 2 (♂ #1, Alb-Cre spleen), 3 (♂ #2, Alb-Cre liver), 4 (♂ #2, Alb-Cre spleen), 5 (♂IkkβF/F liver), 6 (♂IkkβΔhep liver), 7 (Ikkβ-/- MEFs), 8 (wildtype MEFs). Loading controls (both panels) showed comparative intensities of 94-96 kDa bands in all lanes.