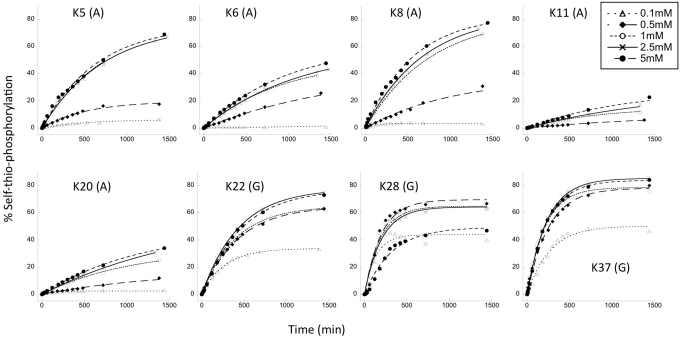
Figure 2.
Dependence of product formation on concentration of NTP donor. Identities of cognate ATPγS (A) and GTPγS (G) donors are given in parentheses. Concentrations are given in the legend in the upper right corner. Plotted data points are the averages of at least three replica, and were fitted with a first-order exponential equation.

