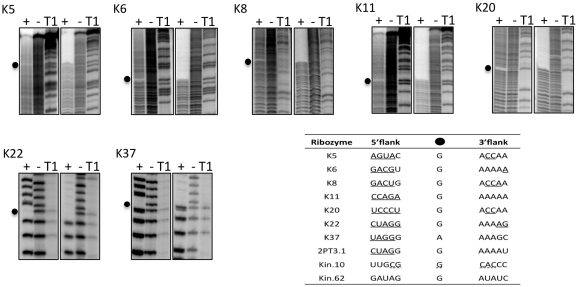
Figure 6.
Mapping thiophosphorylation sites. Autoradiography of alkaline digestion before (−) and after (+) self-thiophosphorylation of each 5′-radiolabeled clone. For each ribozyme, the same digestion products were run on normal (left three lanes) or on tri-layered APM (right three lanes) sequencing gels. Gaps in the digestion patterns (black dots) indicate thiophosphorylation sites. T1, size ladder generated by ribonuclease T1 digestion under denaturing conditions. Inset table shows the local sequence context of internal 2′ phosphorylation sites in kinase ribozymes selected in vitro. Ribozymes K5 through K37 are from this study. Ribozyme 2PT3.1 (29), ribozymes Kin.10 and Kin.62 (13) were isolated previously. Underlined nucleotides are involved in base pairing. Secondary structure of Kin.10 is speculative (dotted lines).

