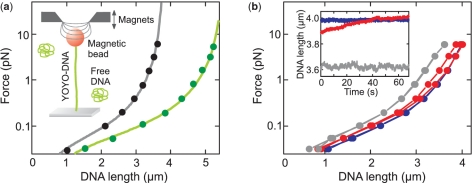
Figure 1.
Force-extension measurements. (a) Force-extension curves of native DNA (filled black circles) and YOYO–DNA (filled green circles) at 1.4 dye / bp with fits to the WLC model (solid lines) providing persistence lengths of 54±3 nm and 56±3 nm, and contour lengths of 3.82±0.01 μm and 5.56±0.02 μm, respectively. (Inset) Sketch of the experimental setup. (b) Force-extension behavior of YOYO–DNA (0.1 dye / bp), measured in 10 mM (line connecting filled blue circles), 100 mM (line connecting filled red circles) and 500 mM phosphate buffer (line connecting filled gray circles). (Inset) Time traces recorded after rapidly changing the force from 0.06 to 5.9 pN. The time axis represents the period after the abrupt force change has occurred. Colors are as in the main image.

