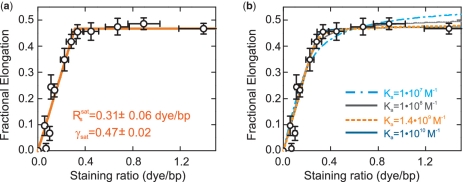
Figure 2.
Dependence of the DNA elongation on the staining ratio Rs. (a) Fractional elongation γ, defined as the increase in contour length due to labeling normalized by the length of the unlabeled molecule, plotted over Rs (open circles). Data were fit with a simple two-line model assuming an initial linear increase below the critical staining ratio  followed by a saturation at γsat (orange solid line). This provided
  = 0.31±0.06 dye/bp and γsat = 0.47±0.02. (b) Experimental data from (a) with fits (lines) to the model of McGhee and von Hippel [Equation (2)] for different association constants Ka. Fitting results are summarized in Table 1. The data were best fit (orange dashed line) for Ka = 1.4 × 10⁹ M−1,
  = 0.31 dye/bp and γsat = 0.50.

