
Figure 3.
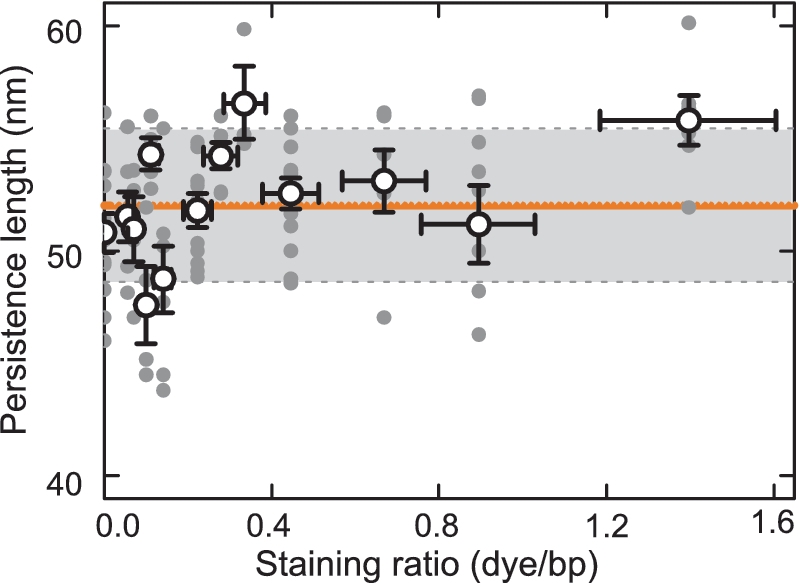
Dependence of the persistence length on the staining ratio. Filled gray circles represent values from individual molecules, open circles the average value of the persistence length at the particular staining ratio and the solid orange line the average value over all molecules. The gray box displays the standard deviation of the global average. A total of 85 molecules was characterized with 3–12 molecules considered at each staining ratio.