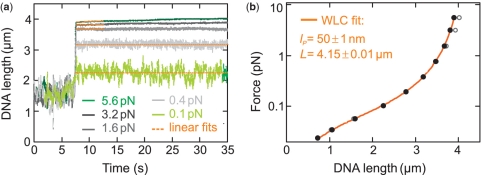
Figure 4.
Force-extension behavior of YOYO–DNA in 100 mM phosphate buffer at Rs = 0.2 dye/bp. (a) Time traces monitoring the change in DNA extension upon a sudden force increase from 0.06 pN to the nominal force (see legend). At elevated forces, the DNA extension continuously increases over the duration of many seconds due to force-induced intercalation. Linear fits to obtain the DNA extension prior additional intercalation occurs (see text) are shown as orange lines. (b) Force-extension curve for the equilibrated (open circles) and the for additional intercalation corrected (filled circles) DNA extension. The orange solid line represents a fit with the WLC model to the corrected data, providing lP = 50±1 nm and L = 4.15±0.01 μm.

