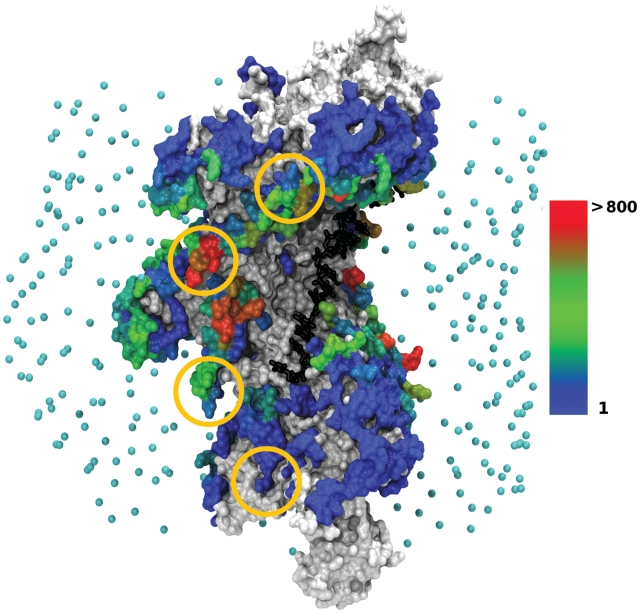
Figure 1.
Location of the dsDNA interaction sites on the filament/ssDNA surface, when dsDNA is the curved DSC structure. Analysis was performed on a set of 27 401 predicted geometries with interaction energies lower than −3.5 RT, where at least one contact is found between the central nine base pairs (8–16) and the filament. The protein filament is represented in surface mode constructed from the atomic representation. The ssDNA strand (black) is represented at atomic resolution in a stick representation. Points in cyan indicate the starting positions of the dsDNA center of mass in the docking simulations with ATTRACT. RecA amino acids are colored according to the number of times they are contacted by the dsDNA, cumulated over the set of predictions. White/gray patches correspond to contact-free amino acids. Amino acids contacted from 1 to 1 142 times are colored according to a color scale, from blue (once) to red (more than 800 times). Gold circles represent the location of experimentally identified DNA binding sites (29) (see text). Interaction sites corresponding to the docking of B-DNA can be found as Supplementary Data 3. The graphic representations in this figure and the following ones have been generated with VMD (30).

