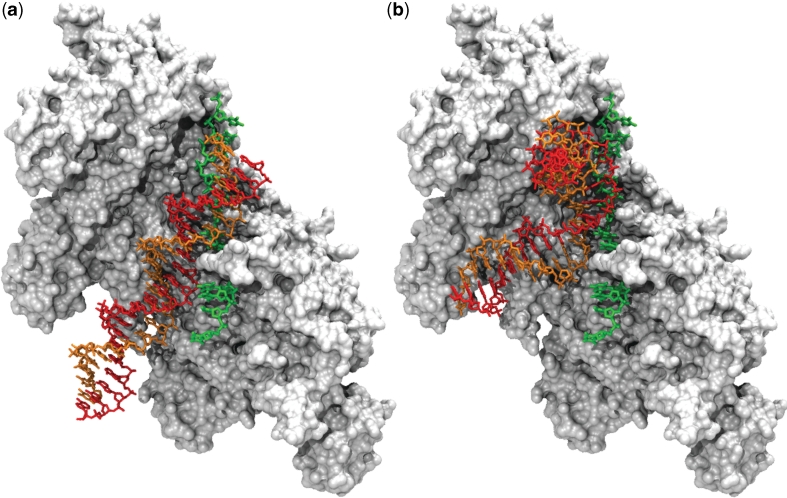
Figure 2.
Result of a docking simulation between a double-stranded B-DNA (DSB) (a) or a curved DNA (DSC) (b) and the RecA/ssDNA filament. The dsDNA is in red for the complementary strand and orange for the strand homologous to the ssDNA. The ssDNA is in green and the surface representation of the protein is white/gray. For a better understanding, the partners of association have been represented at atomic resolution. To this aim, the initial structures (before translation into coarse-grained representation) of DSB (a) or DSC (b) were submitted to exactly the same geometric transformations as those resulting from the docking simulation (8).

