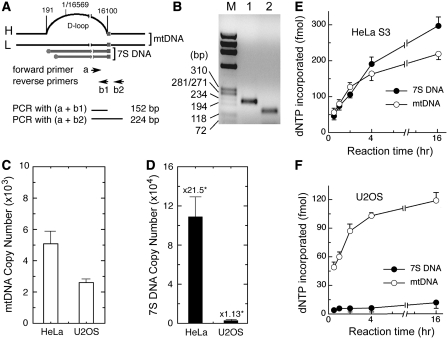
Figure 4.
Comparative analysis of endogenous levels of mtDNA/7S DNA and the mitochondrial capacity to synthesize mtDNA/7S DNA measured in vitro. (A) RT–qPCR was performed to measure endogenous levels of mtDNA and 7S DNA using the primer pairs (a+b1) and (a+b2), respectively. Schematic diagram indicates relative positions of PCR primers and expected PCR products. Numbers on top of mtDNA show nucleotide positions. (B) An aliquot (5 µl) of a representative PCR reaction provided with the primer pair (a+b2) (lane 1) or (a+b1) (lane 2) was analyzed on a 2% agarose gel and DNA was visualized by EtBr staining. ϕX174 DNA-Hae III digests, used as a molecular standard, are indicated (M). (C and D) RT–qPCR was performed with aliquots of diluted CE, equivalent to ∼300 HeLa cells or ∼59 U2OS cells. Average copy numbers of mtDNA (C) and 7S DNA (D) were obtained from two independent duplicate experiments. In (D), numbers on top of each bar indicate fold-abundance of 7S DNA relative to mtDNA. (E–F) Replication reactions were carried out with aliquots of HeLa CE (∼1.5 × 10⁵ cell equivalents) or U2OS CE (∼5 × 10⁵ cell equivalents). The extent of dNTP incorporation into mtDNA and 7S DNA, obtained from two independent duplicate experiments, is presented.

