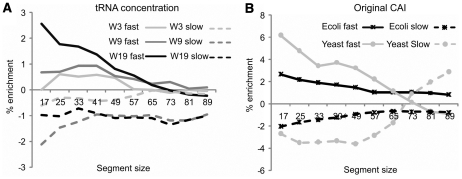
Figure 2.
Domain boundaries are deficient in slow codons and enriched in fast codons. Data is shown using translation speed calculated from tRNA concentration (A) and the original CAI (B). Solid lines represent fast codons and dotted lines slow codons. Enrichment (Y-axis), the percentage increase over that found in the protein as a whole, is shown for different length sections (X-axis) centred on the domain boundary. For tRNA concentration (A) only Ecoli data is available, with data displayed for all three codon speed windows considered in this study (3, 9 and 19). In (B) data is displayed for Ecoli (black) and Yeast (grey) using a codon speed window of 19.

