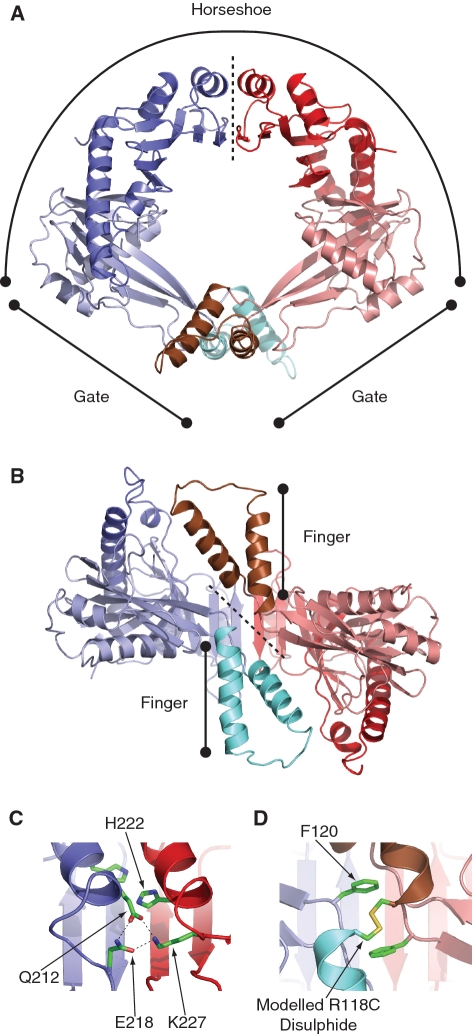
Figure 1.
Structure of RdgC. (PDB co-ordinates 2OWL). (A) A ribbon diagram showing the ring structure of RdgC and identifying the horseshoe and gate regions. The dotted line indicates the horseshoe domain interface. (B) A rotated ribbon diagram illustrating projection of the finger domains. The dotted line indicates the gate domain interface. (C) Detail of one of the hydrogen bond networks at the horseshoe interface between the Q212 and E218 residues on one dimer and K227 on the other. The conserved H222 residues are also shown. (D) Detail of the gate interface interactions, showing the conserved F120 residues and the modelled disulphide formed in the R118C derivative.

