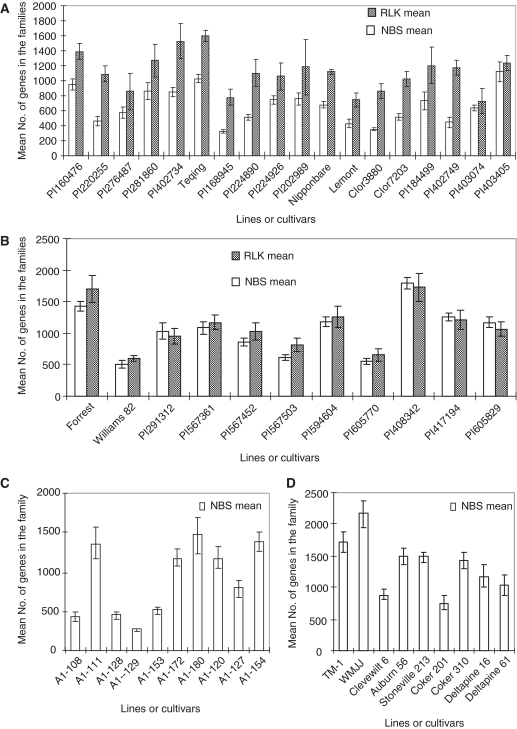
Figure 1.
Intra-specific variation of the NBS and RLK family sizes within (A) O. sativa (2x), (B) G. max (2x), (C) G. herbaceum (2x) and (D) G. hirsutum (4x). The mean number of genes in each accession or cultivar was calculated from four to eight replicates for each NBS or RLK family and the vertical bars indicate SDs (±SE). Up to 5.4-fold variation in number of genes in the gene families was detected among the lines of the species. The intra-specific variations were verified by ANOVA (Table 1).

