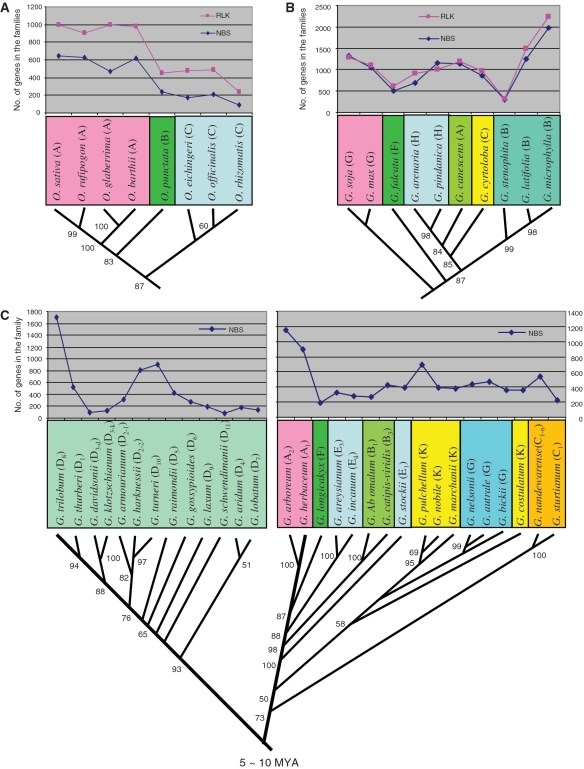
Figure 4.
Association of gene family size variation with organismal phylogentic relationships indicated by phylogenetic distance. The phylogenetic trees and corresponding phylogenetic distances of (A) Oryza, (B) Glyine and (C) Gossypium species were from previous studies (52,55–57). The pairwised difference in number of genes in the families between two species was calculated by subtracting the mean number of the genes in one species from that of the other (Supplementary Table S1), and the phylogenetic distance between them was retrieved from the genetic distance matrix of their phylogenetic tree (Supplementary Table S7). The numbers near each branch of the trees indicate its percentage confidence estimated by bootstrap replications. Note that the size variations of the NBS and RLK families in the Oryza and Gossypium species positively (r = 0.692–0.792, P ≤ 0.004; r = 0.241, P = 0.000) and those in the Glycine species negatively (r=−0.526, P = 0.044) correlate with the species phylogenetic distances.

