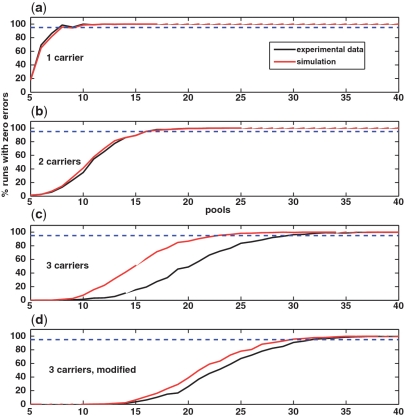
Figure A2.
Carrier identification in an experimental mixture: `experimental data’ versus simulated. The percentage of zero-error reconstructions out of 1000 trials, as a function of the number of pools, for reconstruction based on (38) (black) and simulated data (red). (a–c) Correspond to 1,2 and 3 carriers, respectively. (d) corresponds to reconstructing three carriers, based on pools which contain two carrier at most. The dashed line in each panel corresponds to our zero-error  threshold.

