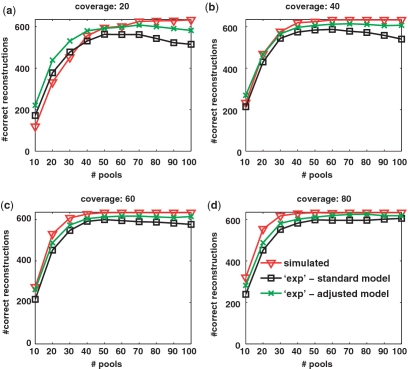
Figure A3.
Number of SNPs correctly reconstructed based on the 1000 Genomes Project data. Number of SNPs with zero-error reconstructions as a function of the number of pools. Each panel corresponds to a different coverage level. The black line corresponds to the standard reconstruction based on generating pools from the 1000 Genomes Project's actual reads, and the red line corresponds to reconstruction based on sampling reads according to our statistical model. The green line corresponds generating pools by adjusting the 1000 Genomes Project's actual reads to account for different read errors for each individual (see text in Appendix 2).

