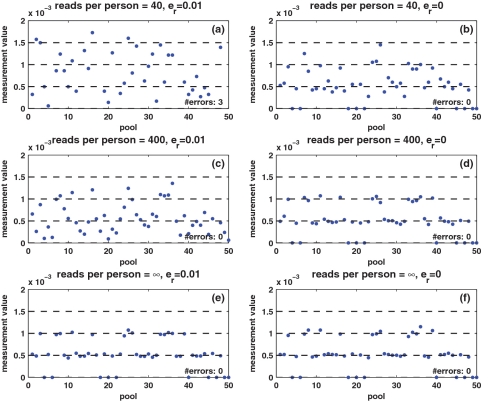
Figure 2.
Example of measured values. The values measured for 50 different pools, for a specific case of N = 2000 individuals and carrier frequency  , thus two individuals carry the alternative allele. Shown are the measured carrier frequencies in each pool, for different coverage levels, (40, 400 and ∞ reads per pool), and different values of the read error (
 ). The data in all panels contain DP errors with σ = 0.05. The dashed lines represent the expected frequencies corresponding to 0,1,2 and 3 rare-allele carriers in a pool. For example, the frequency 10−3 corresponds to two carriers, calculated as the number of rare alleles (2) divided by twice the number of individuals per pool (1000). These frequencies (excluding the one corresponding to three carriers) are the values we would have obtained in the absence of read error, DP errors, and assuming that each pool contains exactly N/2 individuals. The coverage r (i.e. number of reads) is the most dominant factor causing deviations of the observed values from their expectancy.

