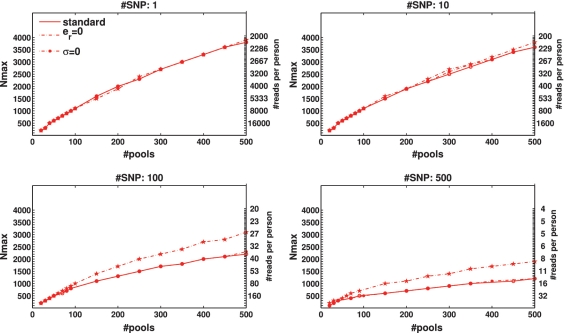
Figure 9.
Effect of read errors and DP errors. The two dashed lines represent results obtained when assuming that reads are perfect and DP errors is zero, respectively. The solid line represents a realistic scenario with a read error of  and DP errors of σ = 0.05. While read error appears to have a significant factor in reducing Nmax, the effect of DP errors is negligible.

