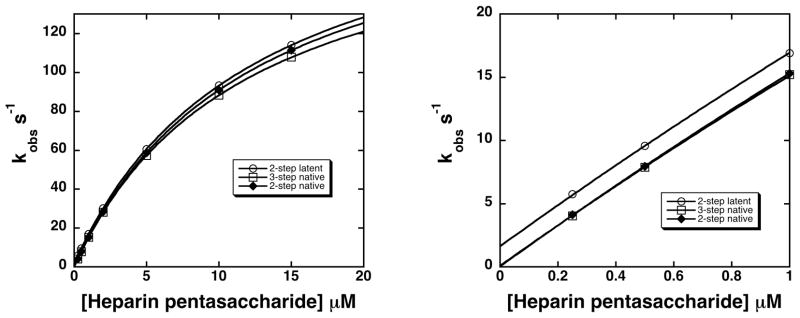
Figure 4. Dependence of kobs for pentasaccharide binding to native and latent antithrombins on pentasaccharide concentration for two and three-step binding mechanisms.
kobs values were obtained from fits of progress curves in figure 3 for two-step (diamonds) and three-step (squares) binding mechanisms of the native antithrombin-pentasaccharide interaction and for the two-step (circles) mechanism of the latent antithrombin-pentasaccharide interaction and plotted as a function of pentasaccharide concentration. Data were fit by the hyperbolic saturation curve given in the text to obtain the kinetic parameters, K1,app, k+lim,app and k−lim,app, shown in table 4. The left-hand panel shows the full range of pentasaccharide concentrations examined and the right-hand panel shows the low pentasaccharide concentration range that reveals the different ordinate intercepts corresponding to k−lim,app.

