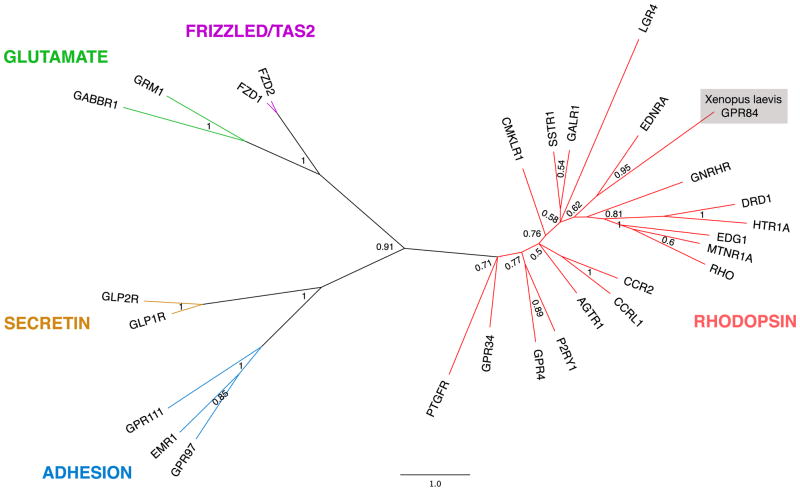
Fig. 2.
The phylogenetic relationship between representative GPCRs is shown. This radial tree represents the relatedness of GPCR proteins from each group of the GRAFS family, as labeled. Note the position of Xenopus laevis GPR84 in the rhodopsin family GPCRs. This tree was calculated using Bayesian inference based on two representative members of each GPCR family, except for the rhodopsin family, where a representative member from each subfamily (A1–A19) was included (see Supplemental Table 1). The branches of this tree were collapsed for simplicity. Labels at node branches represent posterior probabilities of Bayesian analysis. The scale bar indicates number of residue substitutions per site per unit branch length.

