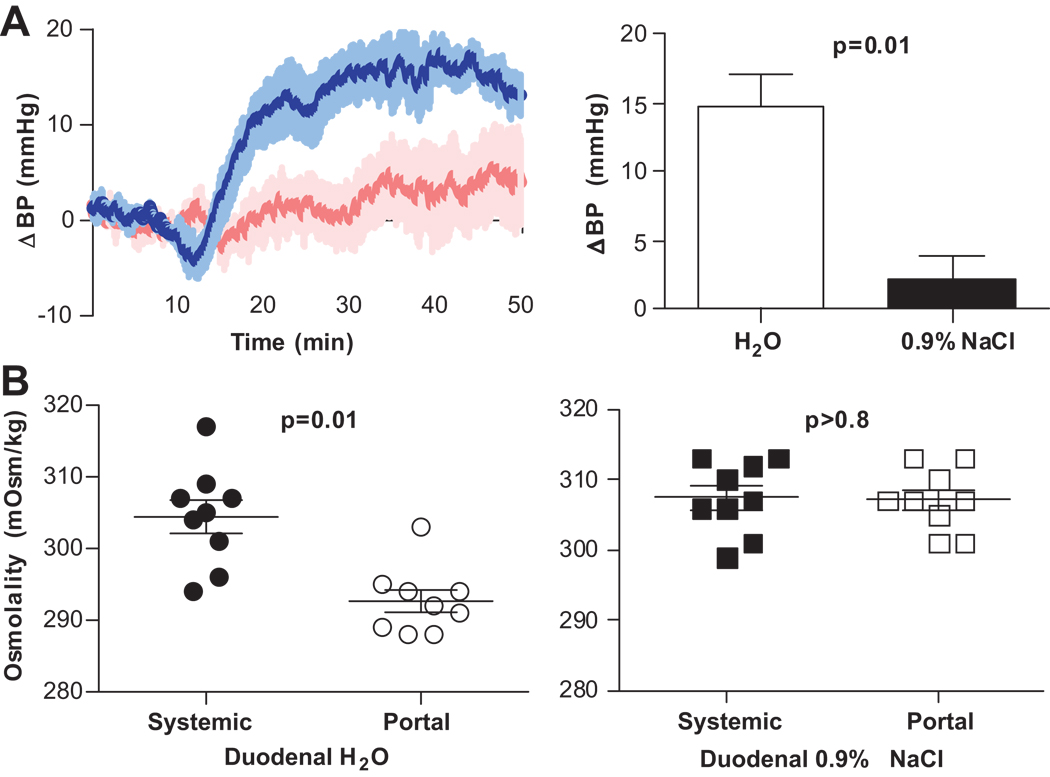
Figure 4. Effect of osmolality on BP.
Change in BP after intraduodenal infusion of water (blue, n=11) or saline (pink, n=6) (25 µL/g). Infusions occurred between 10–16 minutes A, Attenuation of the pressor response during saline infusion implicates hypo-osmolality as the stimulus. B, Systemic (●, ■) and portal (○, □) osmolality 10 minutes after intraduodenal infusion of water (●, ○, n=9) or saline(■, □, n=9). The decrease in portal osmolality after water, but not after saline infusion is consistent with portal/hepatic osmosensor involvement in the pressor response to water.

