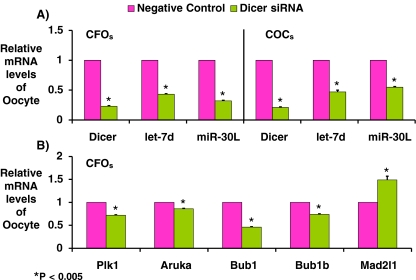
Fig. 4.
Relative mRNA levels of MII oocytes were examined by real-time RT-PCR. After IVM, mRNAs of individual MII oocytes were extracted to detect various gene expressions by quantitative real-time RT-PCR. The  method was used to calculate the relative changes in gene expression. Data are presented as mean+S.D. Three replicates of 20 oocytes each were assayed from each group and beta actin was used as an internal standard. a Relative mRNA levels of Dicer and two miRNAs (let 7d and miRi30C) from Dicer siRNA and negative control injected groups. b Relative mRNA levels of Plk1and AURKA (spindle proteins) and Bub1, Bub1b and Mad2l1 (spindle checkpoints) from Dicer siRNA and negative control injected groups. Data were analyzed by a student t-test. P < 0.05 was considered statistically significant. * indicates significant difference from its negative control, p < 0.005

