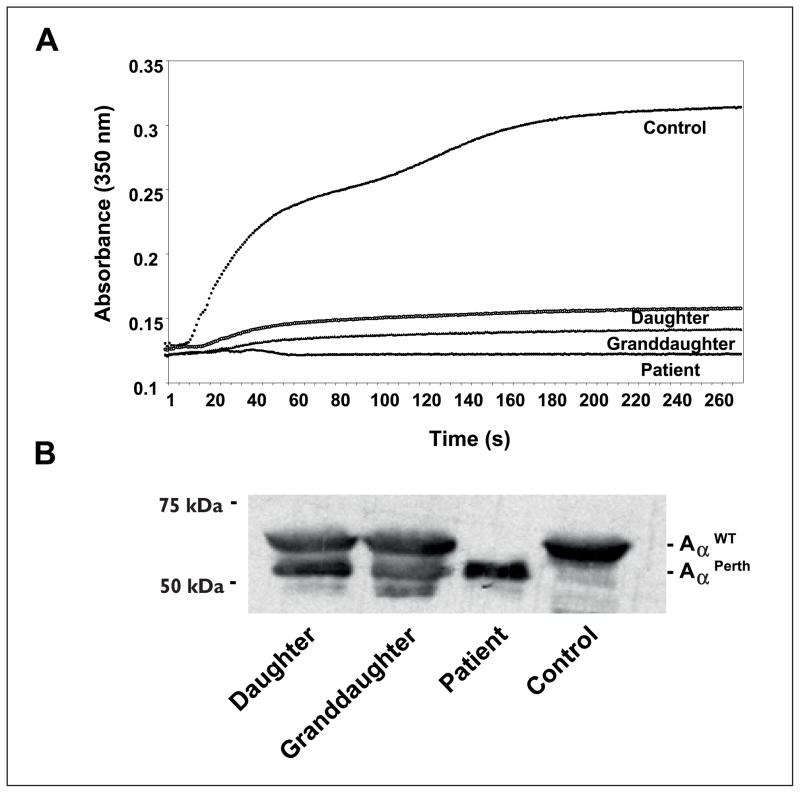
Figure 1. Fibrin polimerisation and Aα chain characterisation.
A) Representative fibrin polymerisation curves. Thrombin (0.1 U/ml) was added to plasma 1:10 diluted in HBS (CaCl2 10mM) and the polymerisation was monitored in triplicate, in a microplate reader at room temperature. Turbidity increase was abolished in the patient’s plasma, while the daughter and granddaughter’s revealed a longer lag-phase and a severe reduction in final turbidity. Control plasma was from a healthy non-related donor. B) Immunoblot analysis of reduced plasma samples run on 7.5% SDS-PAGE, developed with an Aα chain specific antibody. While no normal Aα chain could be seen in the patient, the daughter and granddaughter showed both normal and variant Aα chains at similar levels. Loading was normalised to total plasma protein, and verified by Ponceau stain after SDS-PAGE (data not shown).

