Figure 4.

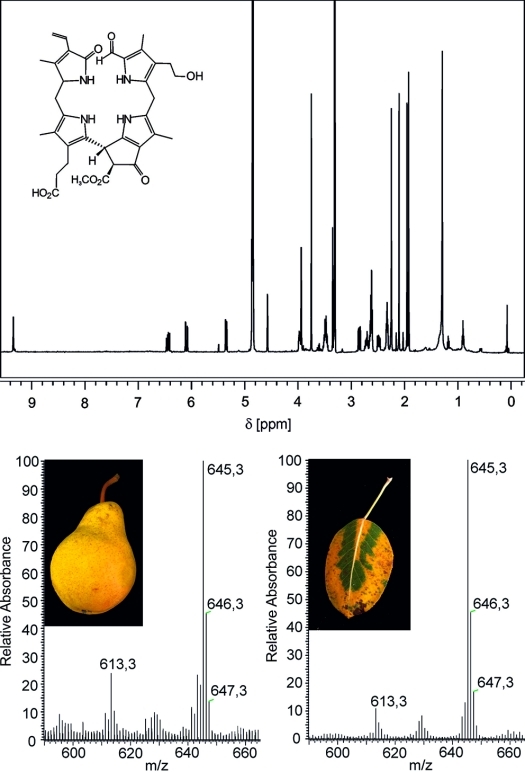
Structure elucidation of “fruit” NCCs by spectroscopic means: 500 MHz 1H NMR spectrum (top) and FAB mass spectra of the NCC (Ms-NCC-2 = Pc-NCC-2 = 2) from apples andpears.47

Structure elucidation of “fruit” NCCs by spectroscopic means: 500 MHz 1H NMR spectrum (top) and FAB mass spectra of the NCC (Ms-NCC-2 = Pc-NCC-2 = 2) from apples andpears.47