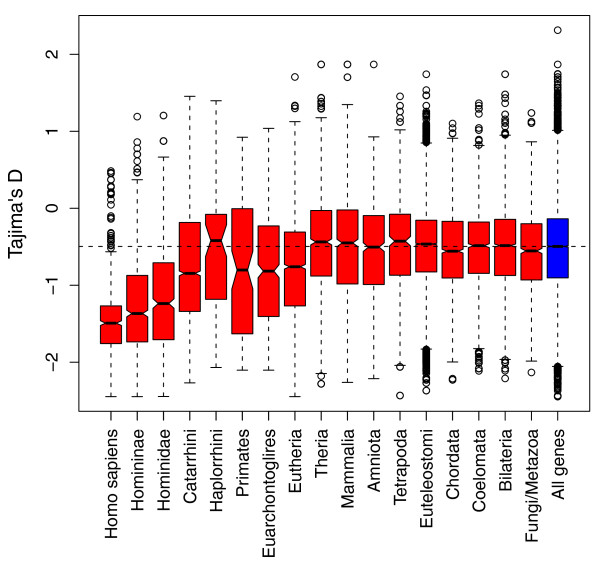
Figure 5.
Tajima's D values for paralogs arisen from gene duplications of different ages. Mean Tajima's D values for genes involved in duplication events of differing ages. Horizontal dotted line indicates median Tajima's D value of all genes in human genome. As can be seen, genes involved in a recent duplication event in general show lower values of D than the genome-wide average, with genes involved in a duplication event specific to Humans, as a group, showing the lowest values of D. (Kruskal-Wallis P < 2.2 × 10⁻¹⁶).

