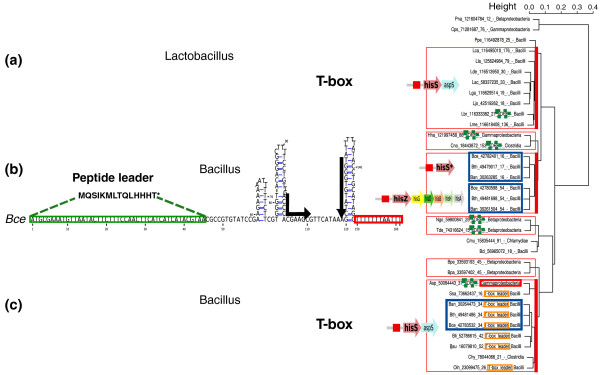
Figure 5.
Regulators of the hisS gene family. The dendrogram on the right represents a hierarchical clustering of candidate attenuator sequences. Clusters of conserved sequences defined by a threshold E-value of 10-4 are framed. Blue frames highlight three groups of paralogs found in bacilli. Dotted frames indicate candidates previously annotated as short hypothetical proteins ('sORF'). (a) A T-box found upstream of hisS in lactobacilli. (b) Histidine leader peptide identified in bacilli upstream of two paralogs of hisS. (c) A T-box found upstream of hisS in bacilli and other species, including isolated Gammaproteobacteria and Chlorobia.

