
Figure 1.
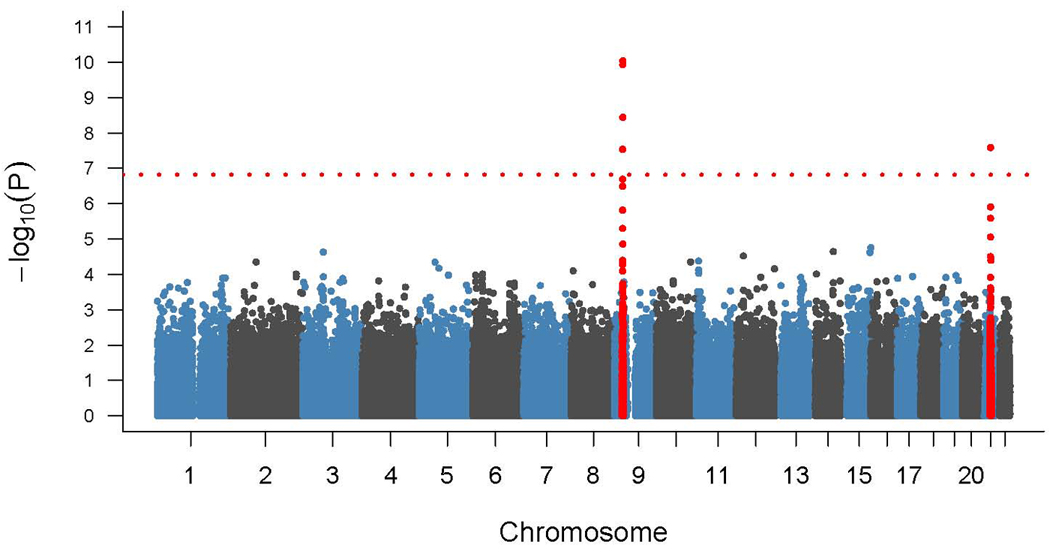
Graphical representation of p-values from genome-wide association study of 405 Finnish ALS cases and 497 elderly Finnish controls. P-values are log transformed (y-axis) and plotted against chromosomes (x-axis). The red dotted line indicates the Bonferroni threshold. Signals indicated in red are on chromosome 9p21 and chromosome 21q22 and surpass the Bonferroni threshold for genome-wide significance.