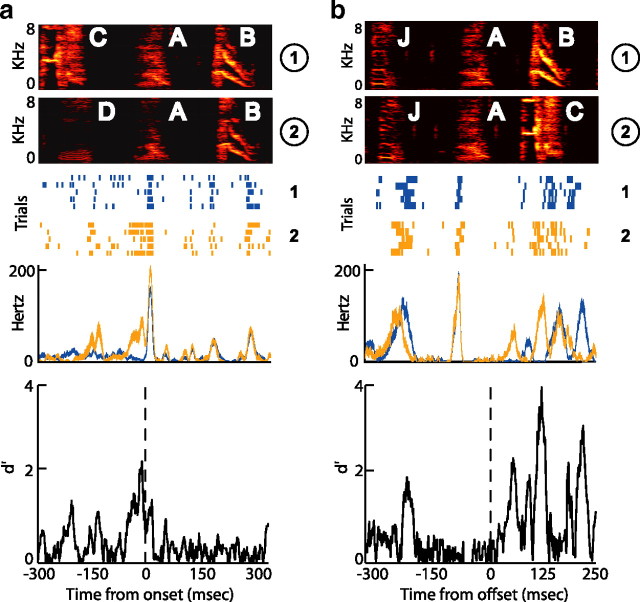
Figure 10.
Quantifying sequence-dependent differences in neural activity. a, Comparing RA neural activity across sequences at a convergent syllable. Top, Spectrograms of convergent sequences CAB and DAB in BF08 and raster plot of activity in a single RA neuron during 10 iterations of CAB (blue) and DAB (orange). Other plotting conventions are as in Figure 9. Middle, Smooth rectified firing rates. Bottom, Difference between the smoothed firing rates (d′) in the two sequences as a function of time. b, Comparing RA neural activity across sequences at a divergent syllable. Shown are spectrograms and firing rates for convergent sequences JAB and JAC. Other plotting conventions are as in a.

