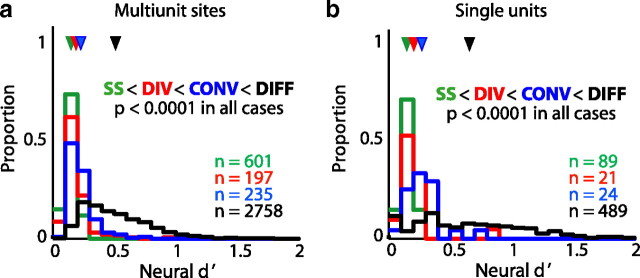
Figure 12.
Comparison of RA activity for different categories of syllables. a, The probability distribution of d′ statistics of multiunit activity for each syllable category: same syllable, same sequence (SS) (green); divergent syllables (DIV) (red); convergent syllables (CONV) (blue); and differently labeled syllables (DIFF) (black). Distributions of neural d′ values for all syllable categories were significantly different from one another (KS test, p < 0.0001). b, The distribution of d′ values for single-unit activity for each syllable category: same syllable, same sequence (green); divergent syllables (red); convergent syllables (blue); and differently labeled syllables (black). Distributions of neural d′ values for all syllable categories were significantly different from one another (KS test, p < 0.05).

