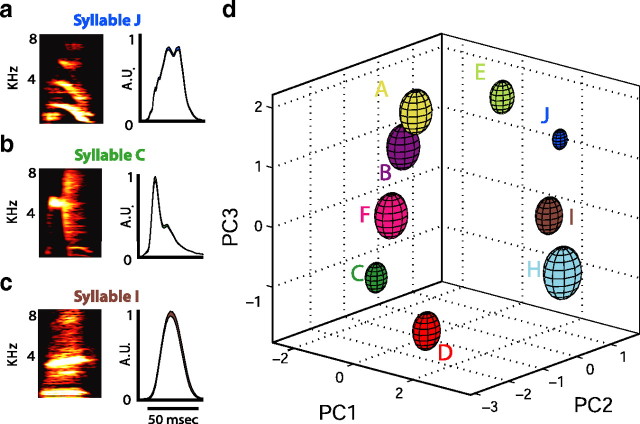
Figure 2.
Measurements of syllable structure. a, Spectrogram and smoothed, rectified amplitude waveform for syllable J of BF03. b, Spectrogram and smoothed, rectified amplitude waveform for syllable C of BF03. c, Spectrogram and smoothed, rectified amplitude waveform for syllable I of BF03. d, Example of syllable clustering after PCA. Plotted are mean ± 1 SD ellipsoids for the first three principal components of nine differently labeled syllables in the song of BF03.

