
Figure 9.
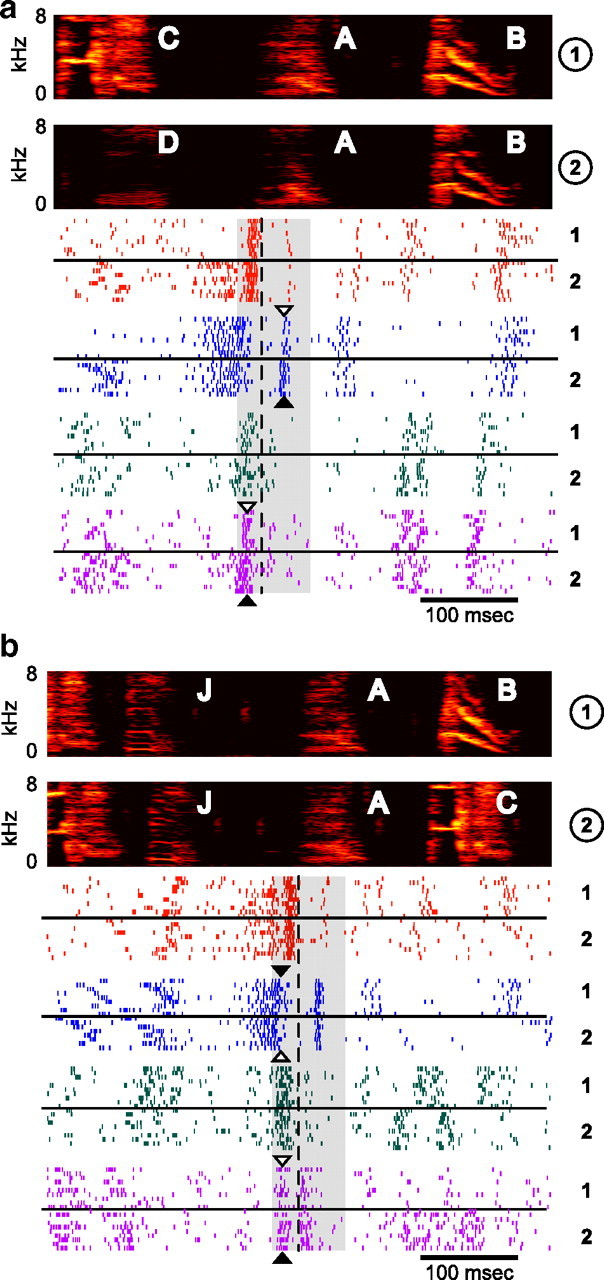
RA activity at convergent and divergent syllables. a, Examples of four RA recordings (2 single-unit, top; and 2 multiunit, bottom) during convergent syllable A from BF08. Spectrograms (top) show examples of convergent syllable A sung in two different sequences (labeled 1 and 2 at right). Raster plots show spike times (aligned at the onset of syllable A; dashed line) for 10 trials in each of the two sequences, as labeled to the right of each example. The premotor window for syllable A is shaded in gray. b, Four RA recordings (2 single-unit, top; and 2 multiunit, bottom) during divergent syllable A in the same bird (for an explanation of how a syllable can be both convergent and divergent, see Materials and Methods). Plotting conventions are as in a. Differences in neural activity, which were quantified using the d′ statistic (see text), are sometimes visible by eye, as in the case of the unit shown in blue in a, in which a burst during the production of syllable A has significantly more spikes during sequence 2 (black arrowhead) than sequence 1 (white arrowhead). Other instances of sequence-dependent differences in neural activity are highlighted with black and white arrowheads, which indicate the context in which more or fewer spikes were produced, respectively.