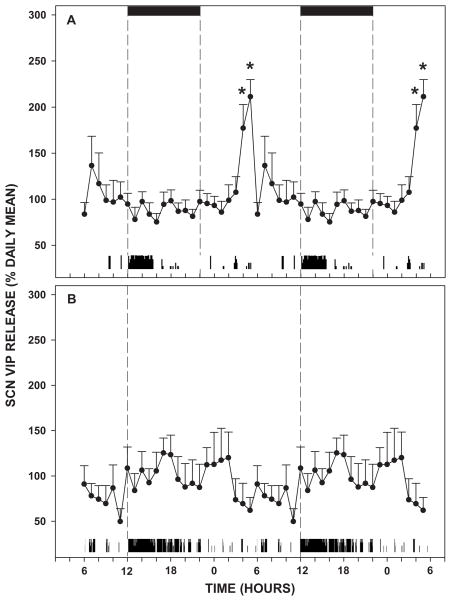
Figure 3.
A: Daily profile of SCN VIP release under LD. The 24 hr profiles are double-plotted to highlight the rhythmic diurnal release pattern. Black bars represent the dark-phase. Below each graph is a representative actogram displaying locomotor activity of an animal undergoing microdialysis sampling. B: Average daily profile of VIP release from the SCN under DD. Dotted lines indicate CT 12. The sampling interval was 1 hr and data points are the mean±S.E.M. * p<0.05 vs other time-points.

