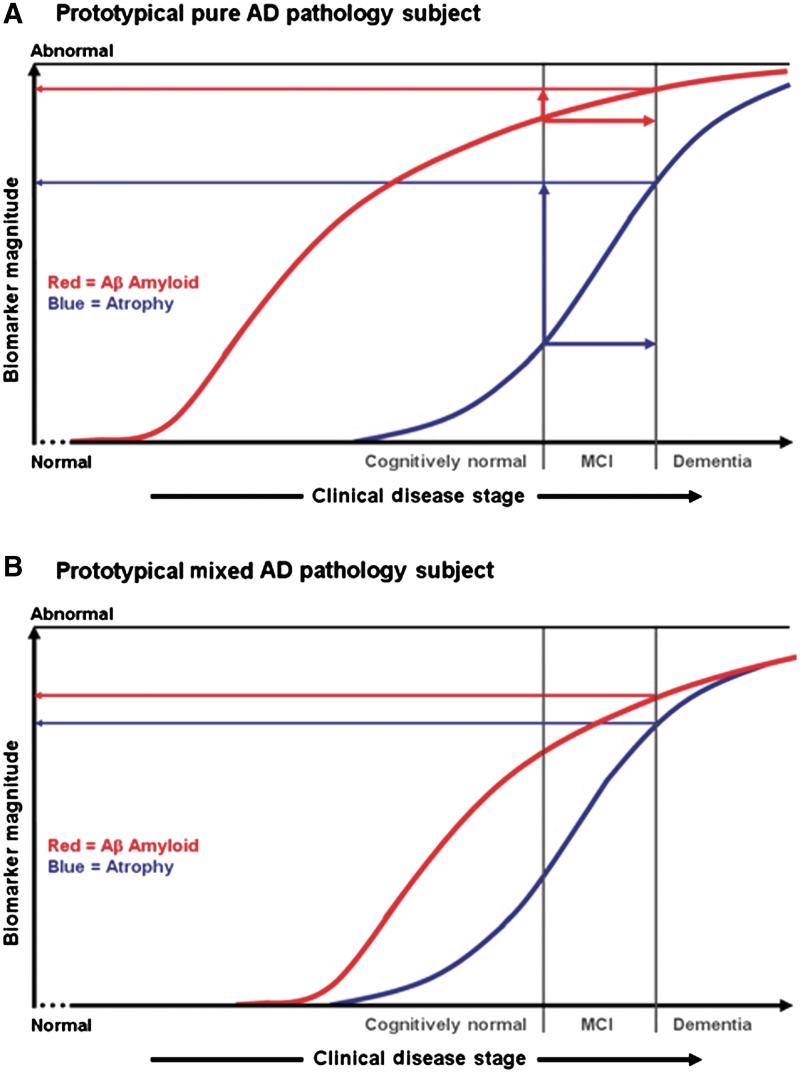
Figure 3.
Hypothetical effects of pure Alzheimer’s pathology versus mixed pathology on time-to-progression from mild cognitive impairment to dementia. Clinical disease stage is indicated on the horizontal axis with vertical lines indicating the time at which diagnoses of mild cognitive impairment and dementia are reached. The severity of Aβ load (red curve) and brain atrophy (blue curve) on the vertical axis range from normal to maximally abnormal. (A) [modified from Jack et al. (2010)], illustrates the hypothetical biomarker curves of Subject A, who progresses from normal to mild cognitive impairment to dementia and who has pure Alzheimer’s pathology. Over the time a subject traverses the horizontal ‘clinical distance’ from time-of diagnosis of mild cognitive impairment to time-of diagnosis of dementia (indicated by the horizontal red and blue arrows), the vertical ‘distance travelled’ along the Aβ load biomarkers curve is small as indicated by the red vertical arrow in (A). In contrast, over this same ‘clinical distance travelled’ on the horizontal axis, the vertical distance travelled along the MRI biomarker is substantial as indicated by the blue vertical arrow in (A). (B) illustrates the hypothetical curve of Subject B, who has mixed pathology. The effect of the coexistent second pathology is to shift the blue atrophy curve, time-of diagnosis of mild cognitive impairment, and time-of diagnosis of dementia closer to the Aβ curve. Consequently Subject B reaches a diagnosis of dementia with a lower level of Aβ in situ than Subject A. AD = Alzheimer’s disease; MCI = mild cognitive impairment.

