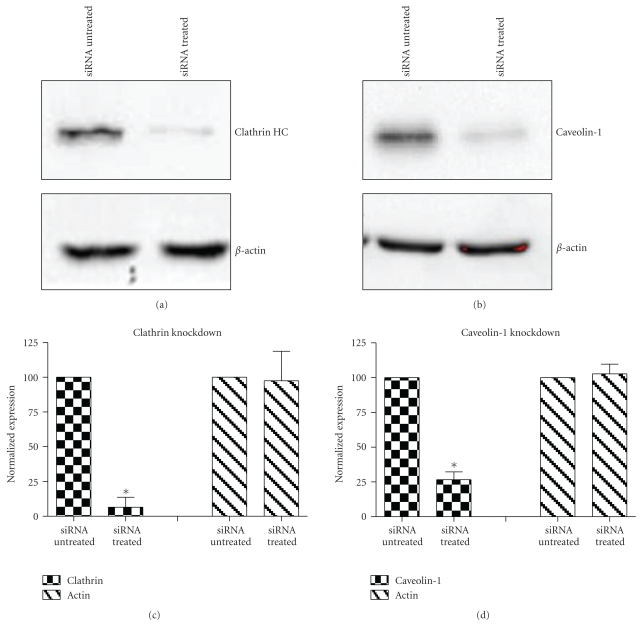
Figure 10.
Western blot analysis of clathrin HC and caveolin-1 protein after siRNA treatment. A549 cells were treated with siRNA of clathrin HC or caveolin-1 protein for 3 days, and then cells were lysed for Western blot analysis. (a) Clathrin HC protein expression in A549 cells. (b) Caveolin-1 protein expression in A549 cells. β-actin was used as the internal control. (c) and (d) Quantification analysis of the Western blots. Intensity is normalized to the siRNA untreated group. Values are mean ± SD from three independent experiments (*P's < .01 versus control).

