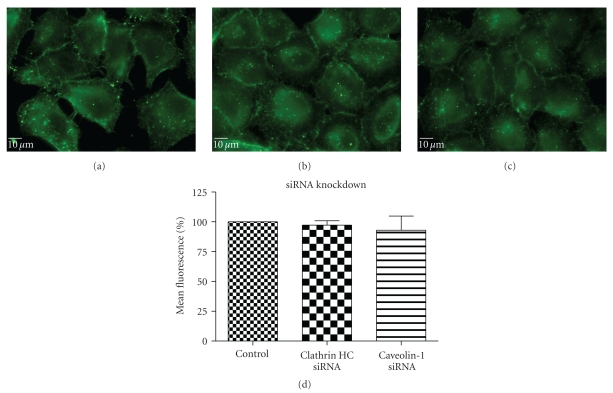
Figure 11.
QD/SR9 uptake after knockdown of clathrin HC and caveolin-1 protein (150 nM; 1 : 20; 1 hour). A549 cells were treated with siRNA of clathrin HC or caveolin-1 protein for 3 days, and then cells were used for uptake studies. (a) Control cells. (b) Cells pretreated with clathrin HC siRNA. (c) Cells pretreated with caveolin-1 siRNA. Images are from a single plane of Z series. (d) Fluorescence intensity. Values are mean ± SD from three independent experiments.

