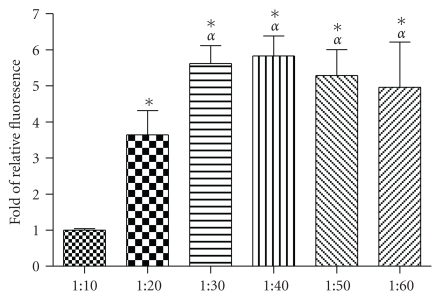
Figure 2.
QD uptake with SR9 at different molecular ratios. QDs were premixed with SR9 at molecular ratios from 1 : 10 to 1 : 60. A549 cells were treated with QD/SR9. Values are mean ± SD from three independent experiments. Fluorescence intensity is normalized relative to the value at 1 : 10. *P < .01 versus 1 : 10; αP < .01 versus 1 : 20.

