Figure 6.
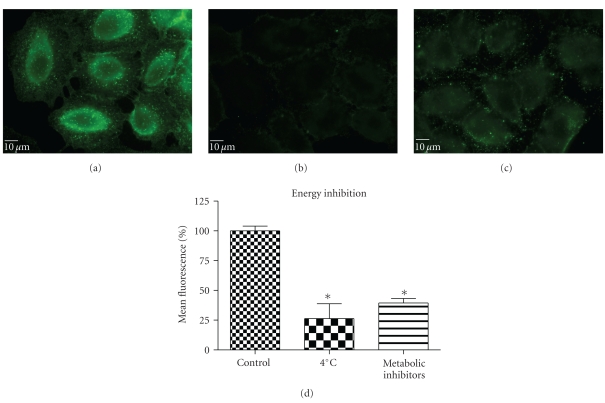
Energy inhibition reduced internalization of QD/SR9 (150 nM; 1 : 20; 1 hour). (a) Control cells. (b) Cells pretreated at 4°C for 30 min then incubated with QD/SR9 for an additional 1 hour. (c) Cells pretreated with a metabolic inhibitor mixture for 1 hour then incubated with QD/SR9 for an additional 1 hour. Images are from a single plane of Z series. (d) Fluorescence intensity. Values are mean ± SD from three independent experiments (*P's < .01 versus control).

