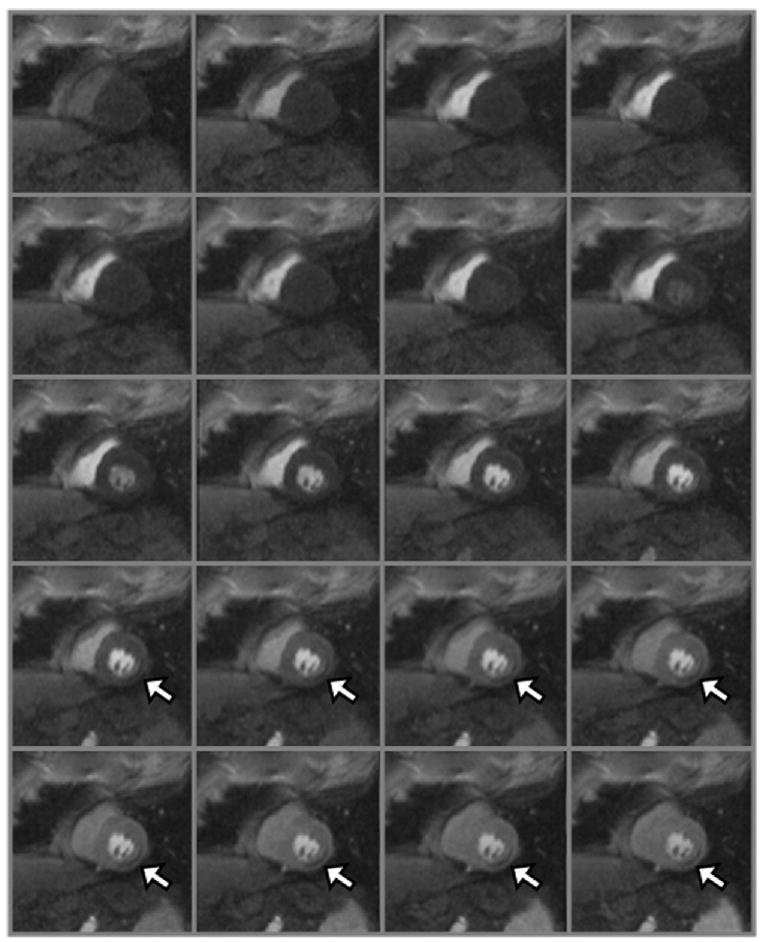
Figure 1.

Twenty frames of a first-pass perfusion CMR study are shown. It should be noted that the signal intensity increases in the right ventricle as the gadolinium passes through. Next, the signal in the pulmonary vasculature increases, followed by the left ventricle and the aorta. Ultimately, the signal enhances in the myocardium. A perfusion defect (arrows) is present in the inferolateral wall.
